Receiver operating characteristic (ROC) curve
On this page
Definition & origin
Originating from radar signal detection during WWII, the ROC curve was later adopted in medicine to assess diagnostic test accuracyIt is a plot of sensitivity (true positive rate) on the y-axis versus false-positive rate (1 − specificity) on the x-axis for various test thresholds.
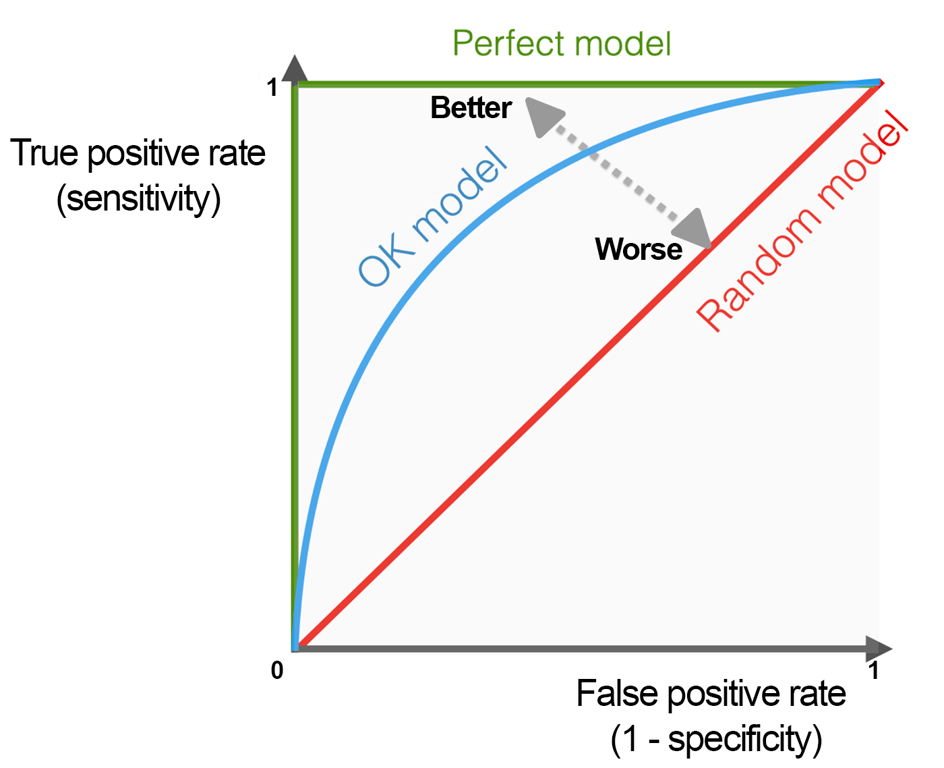 | |
ROC curve. Click on image to enlarge
Purpose
The ROC curve helps visualise the trade-off between sensitivity and specificity as the diagnostic threshold changes
Used to:
- Compare different diagnostic tests or models
- Choose optimal thresholds that balance sensitivity and specificity
Area under the curve (AUC)
AUC summarises overall test performance:
- 1.0 = perfect discrimination
- 0.5 = no better than chance
Qualitative ranges:
- 0.90–1.00 = excellent;
- 0.80–0.90 = good;
- 0.70–0.80 = fair
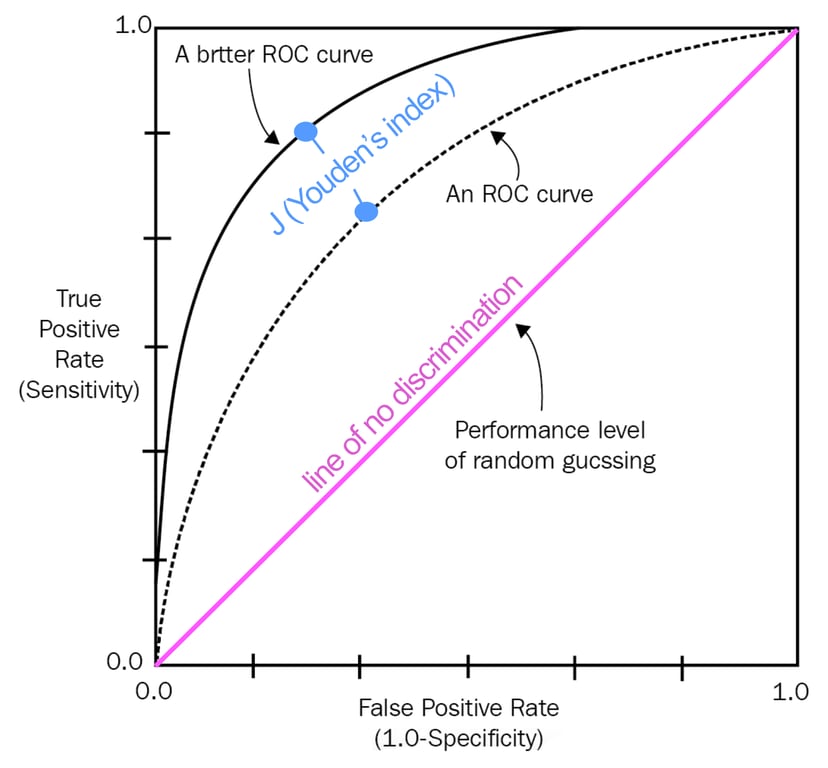 | |
ROC curves. Click on image to enlarge
Optimal Threshold & Youden’s J
Youden's J statistic (also called Youden's index) is a single statistic that captures the performance of a dichotomous diagnostic test. The “best” cut-off point on the ROC curve maximises Youden’s index.
J = sensitivity + specificity − 1
It's chosen based on clinical context, weighing whether sensitivity or specificity is more critical. Graphically, it corresponds to the point on the ROC curve furthest from the diagonal line (the line of no discrimination i.e. AUC = 0.5)
Strengths
Provides a comprehensive evaluation of test performance across all thresholds.Independent of prevalence, making it useful in studies with varied disease frequencies
Limitations & considerations
AUC may mask clinically important differences at specific thresholds, partial AUC (pAUC) may be more relevant in high-risk clinical regionsROC curves do not reflect predictive values (i.e., PPV/NPV), which depend on disease prevalence .
Interpret AUC in the context of clinical consequences: e.g., poor sensitivity may matter more than poor specificity for some conditions