Forest plot
A forest plot is a graphical representation used in meta-analyses to display:
It provides a clear visual summary of the strength, direction, and precision of the evidence.
Forest plot components and interpretation
Heterogeneity
Heterogeneity occurs when differences in study results exceed what would be expected by chance, even after accounting for random variation. It reflects variability in results due to different populations, interventions, methodologies, etc.
Visual clues in a forest plot:
Statistical measure:
Key point
A forest plot provides a visual summary of individual study results and the combined evidence, helping you judge both statistical significance and consistency of findings.
- The individual results of studies addressing the same question
- The pooled summary effect
- The consistency (or heterogeneity) of findings across studies
It provides a clear visual summary of the strength, direction, and precision of the evidence.
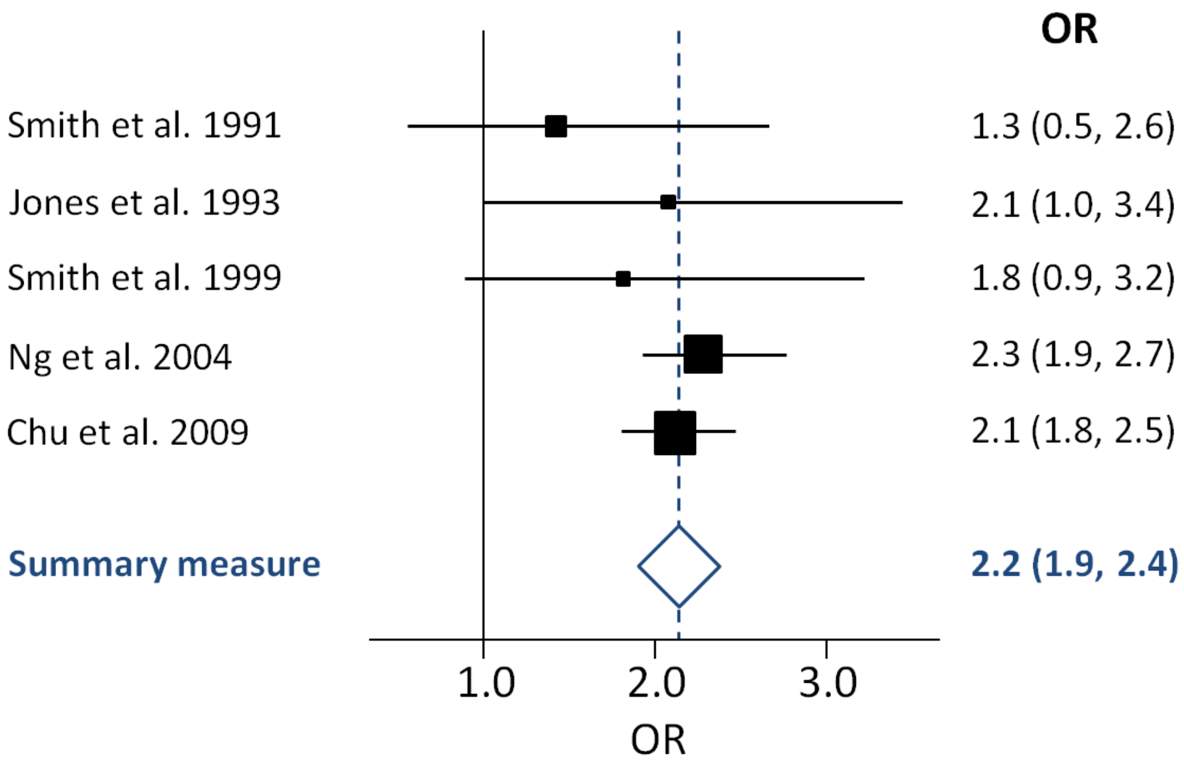 | |
Example forest plot. Click on image to enlarge
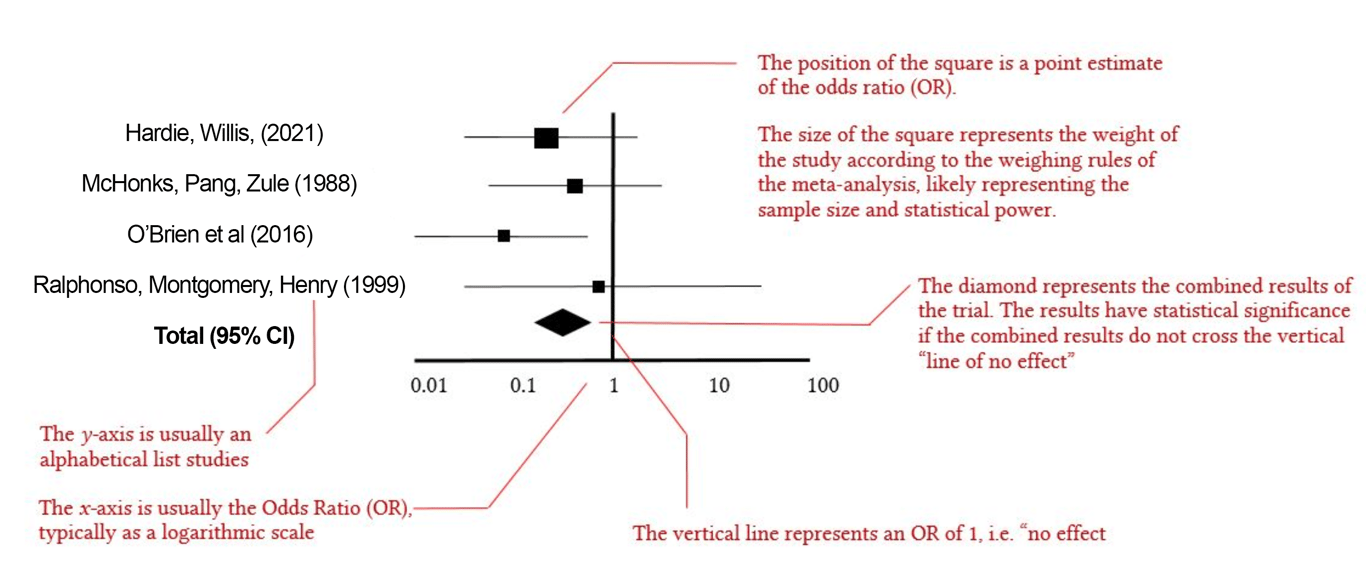 | |
Anatomy of a forest plot. Click on image to enlarge
Forest plot components and interpretation
| Component | Description |
|---|---|
| Study names (left side) | Listed in chronological or alphabetical order |
| Effect size plot (right) | Usually odds ratio (OR), risk ratio (RR), or mean difference |
| Square (point estimate) | The midpoint represents the study’s estimated effect size |
| Horizontal line (CI) | Represents the 95% confidence interval (CI) for each study’s effect size |
| Square size (weight) | Area of the square reflects the statistical weight of the study (typically based on sample size and variance) |
| Diamond (summary estimate) | The centre of the diamond represents the pooled effect size from all studies; the width shows its 95% CI |
| Vertical line of no effect | Represents no difference between treatment and control (e.g. OR = 1, RR = 1, MD = 0) |
| Statistical significance | If a study’s CI crosses the line of no effect, its result is not statistically significant. Same applies to the pooled estimate (diamond) |
Heterogeneity
Heterogeneity occurs when differences in study results exceed what would be expected by chance, even after accounting for random variation. It reflects variability in results due to different populations, interventions, methodologies, etc.
Visual clues in a forest plot:
- If confidence intervals do not overlap, or study estimates vary widely, heterogeneity is likely
- If horizontal lines (CIs) largely overlap, the studies are more likely to be homogeneous (differences are mostly due to chance).
Statistical measure:
- Often assessed using the I² statistic, which quantifies the percentage of total variation due to heterogeneity (not shown directly in the plot but reported alongside).
How to Interpret a Forest Plot
- 1. Look at individual studies: Are most results on one side of the line of no effect?
- 2. Assess confidence intervals: Do they cross the line? Are they wide or narrow?
- 3. Check the diamond: Centre = overall effect, Width = precision, Overlapping line of no effect? = Not statistically significant.
- 4. Scan for heterogeneity: Visually and via I² if available.
Key point
A forest plot provides a visual summary of individual study results and the combined evidence, helping you judge both statistical significance and consistency of findings.