Standard deviation, variance and the empirical rule
In medical statistics, it is important to understand not only the central tendency of data (such as the mean or median), but also how widely values are spread. This spread is described using different measures depending on the shape of the data distribution.
Measures of variation based on distribution
For normally distributed data, the mean and standard deviation (SD) are used to describe variation.
For non-normally distributed data, the median and interquartile range (IQR) are more appropriate.
Standard deviation is particularly useful when describing normally distributed data and is also critical in calculating confidence intervals and performing hypothesis testing.
Note: The standard error (SE) is different, it describes how precisely the sample mean estimates the population mean, and is calculated as:
where n is the sample size.
The Normal (Gaussian) Distribution
The normal distribution is a fundamental concept in medical statistics and is characterised by:
* 68.2% of values lie within ±1 SD of the mean
* 95.4% of values lie within
This rule helps clinicians and researchers identify what range of values can be considered 'typical' or expected in a dataset.
Measures of variation based on distribution
For normally distributed data, the mean and standard deviation (SD) are used to describe variation.
For non-normally distributed data, the median and interquartile range (IQR) are more appropriate.
Standard Deviation
The standard deviation is a commonly used measure of variability that shows how much individual values deviate from the mean of a data set.Definitions:
- Variance is the average of the squared differences from the mean.
- Standard deviation is the square root of the variance. It is approximately the average distance between each data point and the mean.
Standard deviation
Standard deviation is a statistical measure that quantifies the amount of variation or dispersion in a set of values.
More precisely it is the square root of the variance, and it represents the average distance of each data point from the mean of the data set.
Larger SD indicates greater variability, whilst a smaller SD indicates that values are closer to the mean.
Standard deviation is particularly useful when describing normally distributed data and is also critical in calculating confidence intervals and performing hypothesis testing.
Note: The standard error (SE) is different, it describes how precisely the sample mean estimates the population mean, and is calculated as:
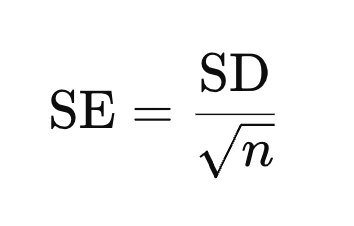 | |
where n is the sample size.
The Normal (Gaussian) Distribution
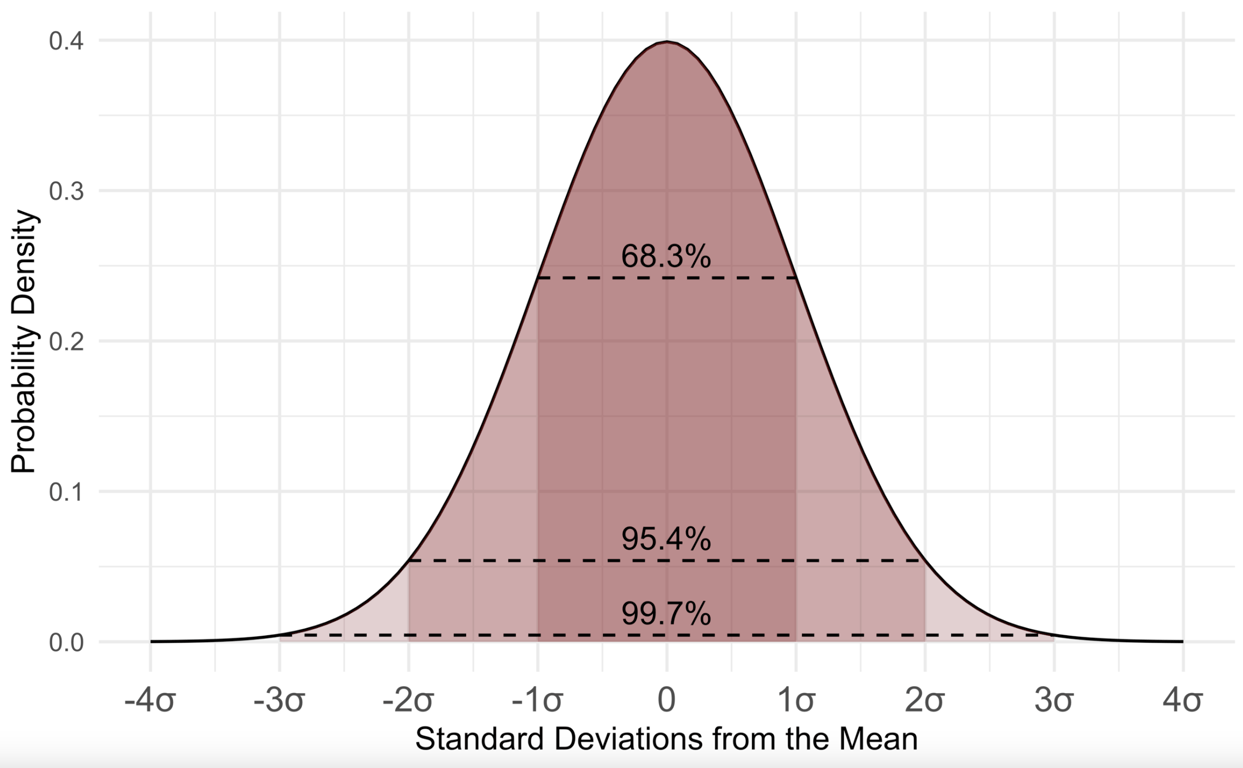 | |
Normal distribution visualisation with standard deviations shown. Click on image to enlarge
The normal distribution is a fundamental concept in medical statistics and is characterised by:
- A bell-shaped, unimodal curve
- Symmetry about the mean (mean = median)
- Being fully described by two parameters: the mean and the standard deviation
- A shift to the right if the mean increases and to the left if the mean decreases (assuming constant SD)
- A flatter appearance as SD increases, and a more peaked shape as SD decreases (assuming fixed mean - see image below)
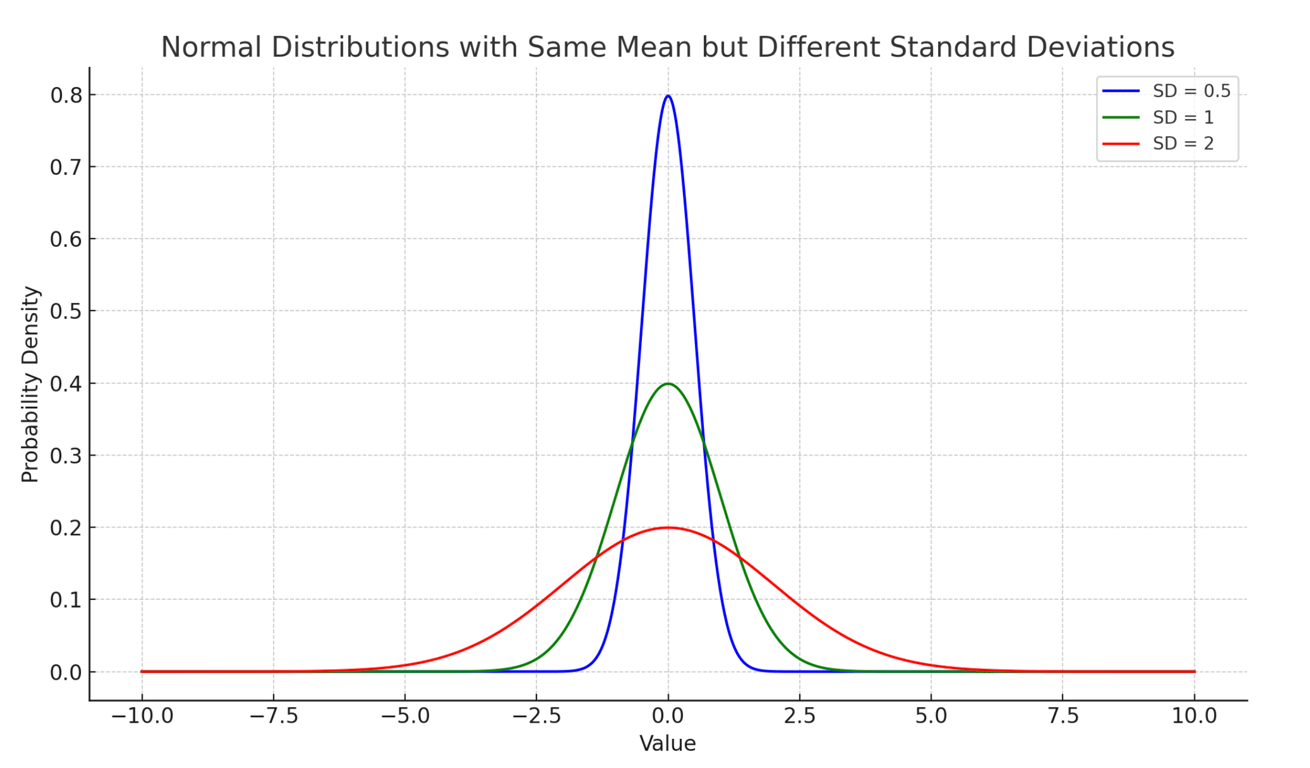 | |
Normal distribution visualisation with same mean but variation in standard deviation. Click on image to enlarge
The empirical rule (68–95–99.7 Rule)
For data that follows a normal distribution, we can make useful predictions based on SD:* 68.2% of values lie within ±1 SD of the mean
* 95.4% of values lie within
±2 SDs
* 99.7% of values lie within±3 SDs
This rule helps clinicians and researchers identify what range of values can be considered 'typical' or expected in a dataset.
Standard deviation is a key tool in medical statistics for assessing variability, especially in data that follow a normal distribution. Recognising when to use the mean and SD versus the median and IQR is essential for accurately describing and interpreting clinical data.