Funnel plot
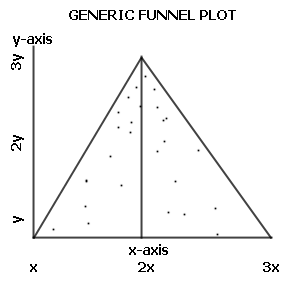
A funnel plot is primarily used to demonstrate the existence of publication bias in meta-analyses. Funnel plots are usually drawn with treatment effects on the horizontal axis and study size on the vertical axis.
Interpretation
The dots represent individual studies. The x-axis is usually a measure of effect often the odds ratio is used here
Interpretation
- a symmetrical, inverted funnel shape indicates that publication bias is unlikely
- conversely, an asymmetrical funnel indicates a relationship between treatment effect and study size. This indicates either publication bias or a systematic difference between smaller and larger studies ('small study effects')
 | |
The dots represent individual studies. The x-axis is usually a measure of effect often the odds ratio is used here