Correlation and linear regression
The terms correlation and regression are related but are not synonymous. Correlation is used to test for association between variables (e.g. whether salary and IQ are related). Once correlation between two variables has been shown regression can be used to predict values of other dependent variables from independent variables. Regression is not used unless two variables have firstly been shown to correlate.
The degree of correlation is quantified using the correlation coefficient (r) which ranges from –1.0 to +1.0:
Typical interpretation ofr values:
The square of the correlation coefficient (r²), called the coefficient of determination, represents the proportion of variance in one variable explained by the other. This helps assess clinical relevance, not just statistical significance.
Pearson’s correlation coefficient (r): used when both variables are continuous and normally distributed i.e. parametric.
Spearman’s rank correlation coefficient (ρ or rₛ): used for ordinal, non-normally distributed, or nonlinear data. It assesses monotonic relationships.
If a nonlinear relationship is suspected, data transformations (e.g. logarithmic or square root) may be needed before applying correlation tests.
The simple linear regression equation is:
y = a + bx
Where:
This model assumes a linear relationship between x and y and is most appropriate for continuous variables.
Linear regression may be classed as simple linear regression using one independent variable
Regression goes further by estimating how much one variable changes in response to another, making it useful in predictive modelling and clinical research.
For categorical (especially binary) outcomes, regression methods such as logistic regression are used instead of linear regression.
Correlation
Correlation measures the strength and direction of a linear relationship between two variables measured in the same group. Importantly, correlation does not imply causation, it only describes the degree to which variables move together.The degree of correlation is quantified using the correlation coefficient (r) which ranges from –1.0 to +1.0:
- r = +1.0: perfect positive linear relationship.
- r = –1.0: perfect negative linear relationship.
- r = 0: no linear correlation.
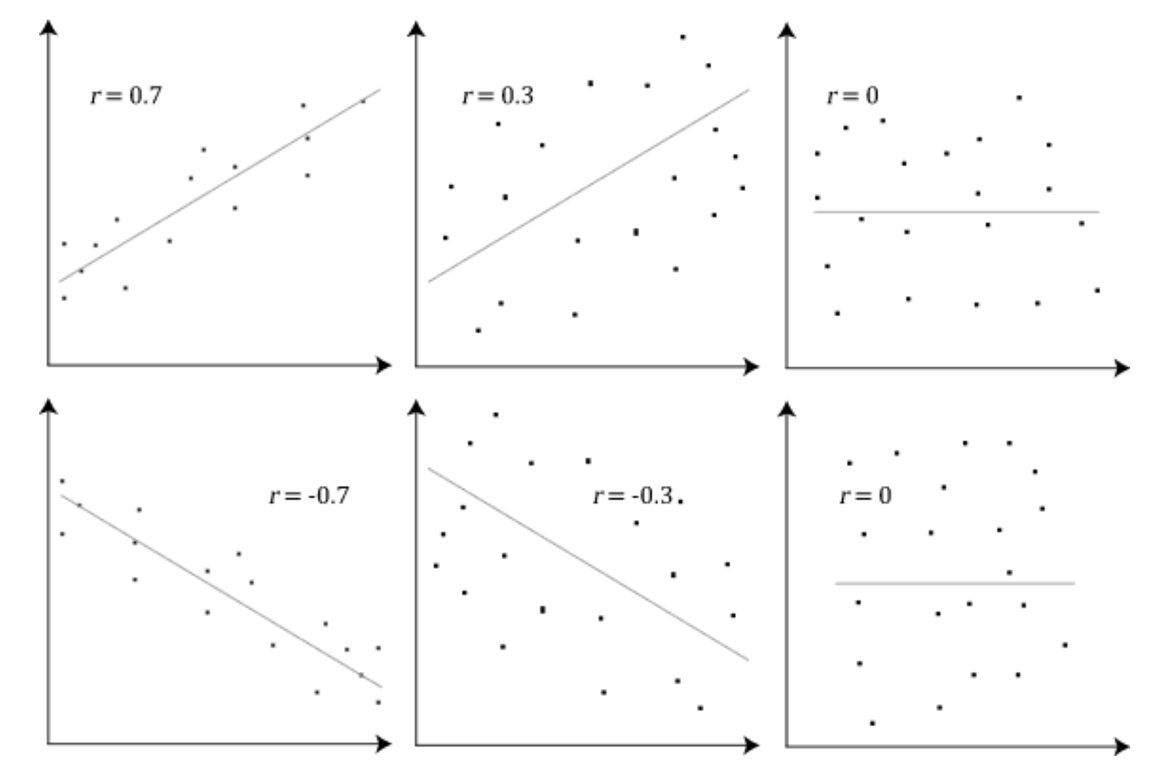 | |
Graphical representation of varying correlation coefficients. Click on image to enlarge
Typical interpretation of
- 0.0–0.2: very weak (likely meaningless)
- 0.2–0.4: weak (may warrant further study)
- 0.4–0.6: moderate
- 0.6–0.8: strong
- 0.8–1.0: very strong (may suggest underlying factors or data issues)
The square of the correlation coefficient (r²), called the coefficient of determination, represents the proportion of variance in one variable explained by the other. This helps assess clinical relevance, not just statistical significance.
Types of correlation coefficients:
Pearson’s correlation coefficient (r): used when both variables are continuous and normally distributed i.e. parametric.
Spearman’s rank correlation coefficient (ρ or rₛ): used for ordinal, non-normally distributed, or nonlinear data. It assesses monotonic relationships.
If a nonlinear relationship is suspected, data transformations (e.g. logarithmic or square root) may be needed before applying correlation tests.
Linear regression
While correlation quantifies the strength of a relationship, linear regression is used to model and predict one variable (the dependent variable, y) from another (the independent variable, x).The simple linear regression equation is:
y = a + bx
Where:
- y = outcome/dependent variable (variable being calculated)
- a = intercept (value of y when x = 0)
- b = slope or regression coefficient (change in y per unit change in x)
- x = predictor/independent variable
This model assumes a linear relationship between x and y and is most appropriate for continuous variables.
Linear regression may be classed as simple linear regression using one independent variable
OR
Multiple linear regression using more than one independent variable (e.g., predicting blood pressure using age, weight, and cholesterol).Important notes
Correlation must be interpreted cautiously as it only shows association, not causality or prediction.Regression goes further by estimating how much one variable changes in response to another, making it useful in predictive modelling and clinical research.
For categorical (especially binary) outcomes, regression methods such as logistic regression are used instead of linear regression.