Survival analysis
Survival analysis is the statistical study of time until an event occurs (often called time-to-event analysis). It is widely used in medical research where patients are followed over time to observe outcomes such as:
Used in:
Challenges in time-to-event Data
Kaplan-Meier Outputs:
Hazard and hazard ratio (HR)
Hazard: The instantaneous risk of the event at a given time.
Hazard Ratio (HR) interpretation:
Cox proportional hazards regression
A semi-parametric model used to:
Summary table of key methods
- Death
- Disease recurrence
- Time to recovery
- Time to hospital readmission
Used in:
- Longitudinal cohort studies
- Randomised controlled trials (RCTs)
Challenges in time-to-event Data
- Unequal follow-up: Patients may enter the study at different times.
- Non-normal distributions: Time-to-event data are rarely normally distributed.
- Censoring: Patients may leave the study, be lost to follow-up, or the study ends before they experience the event.
Censored data
Censored data in survival analysis refers to incomplete information about the time to an event.
Censored data must be included but interpreted appropriately.
Censoring assumes patients lost to follow-up have the same prognosis as those who remain.
Censored data in survival analysis refers to incomplete information about the time to an event.
Censored data must be included but interpreted appropriately.
Censoring assumes patients lost to follow-up have the same prognosis as those who remain.
Kaplan-Meier (KM) survival curve
A non-parametric method to estimate survival over time.- Y-axis: Proportion of patients surviving (event-free)
- X-axis: Time
- Steps: Occur at each event (e.g., death)
- Vertical ticks: Represent censored data
- Does not change at time of censoring, only at events
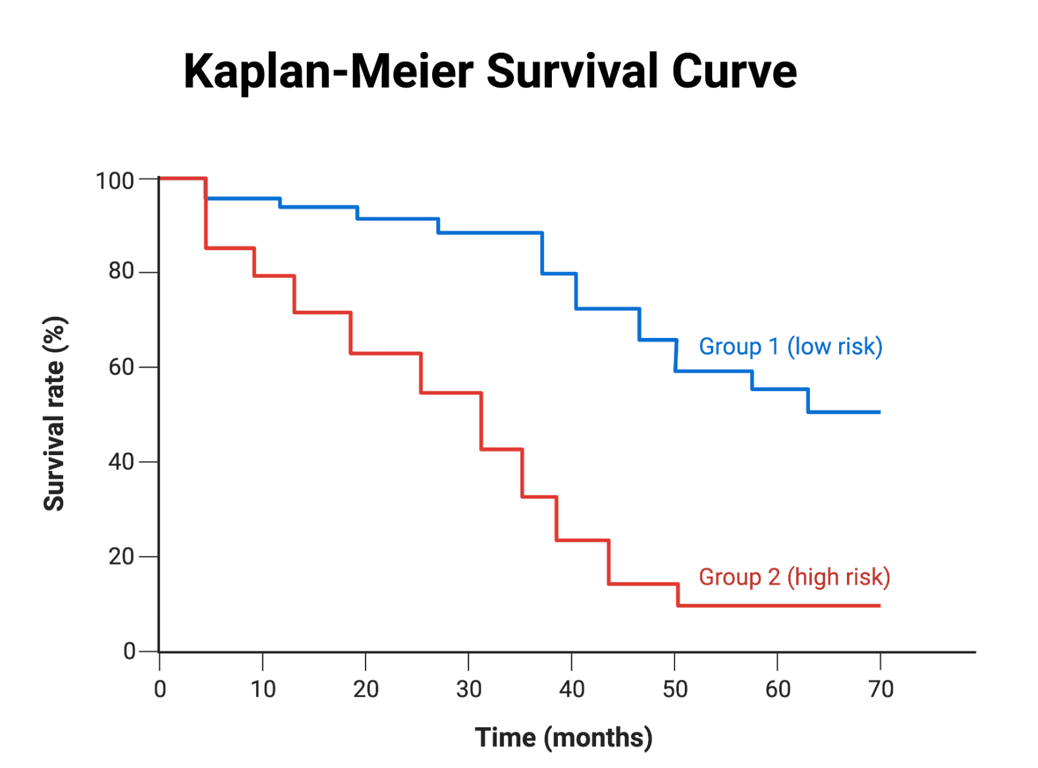 | |
Kaplan-Meier (KM) survival curve. Click on image to enlarge
Kaplan-Meier Outputs:
- Median survival time: Time by which 50% have experienced the event
- Survival probability: Chance of being event-free at a given time
- Comparative plots: Useful to compare survival in treatment vs. control groups
- Use the log-rank test to statistically compare survival curves between groups.
Hazard and hazard ratio (HR)
Hazard: The instantaneous risk of the event at a given time.
Hazard Ratio (HR) interpretation:
- HR = 1 → No difference
- HR < 1 → Reduced risk (e.g., treatment helps)
- HR > 1 → Increased risk (e.g., harmful exposure)
Cox proportional hazards regression
A semi-parametric model used to:
- Adjust for multiple covariates
- Provide adjusted hazard ratios
- Assumes the proportional hazards assumption (i.e., relative risk is constant over time)
Summary table of key methods
| Method | Purpose |
|---|---|
| Kaplan-Meier curve | Estimate survival over time |
| Log-rank test | Compare survival between two or more groups |
| Cox Regression | Assess effect of covariates on survival; outputs hazard ratios |
| Hazard ratio (HR) | Measure of relative risk over time |
| Censoring | Accounts for incomplete follow-up |
Key Points
- KM curves are a good visual tool and accommodate censored data
- Median survival is more useful than mean survival in censored data
- Always check the proportional hazards assumption in Cox regression
- Use the log-rank test for comparing KM curves between groups
- Survival does not always relate to death, it means time until any defined event