Measures of variation in medical statistics
Measures of variation (also called measures of dispersion) describe how spread out or dispersed data values are within a dataset. They help clinicians and researchers understand how much variability exists around measures of central tendency (such as the mean or median).
The most commonly used measures of variation are:
Range
Interquartile range (IQR)
Variance
σ² is the population variance.
Σ is the summation symbol.
xi is each individual data point in the population.
μ is the population mean.
N is the total number of data points in the population.
Graphical Representation: Box and Whisker Plot
A Box and Whisker Plot (often referred to as simply a Box Plot) is a graphical summary of a dataset that displays its distribution, central tendency, and variability.
What it shows:
Why it's useful:
The most commonly used measures of variation are:
- Range
- Interquartile range
- Variance
- Standard deviation
Range
- Definition: The difference between the largest and smallest values in a dataset.
- Formula: Range = Maximum value - Minimum value
- Use: Gives a quick sense of the total spread of data, but is highly affected by outliers.
Interquartile range (IQR)
- Definition: The range of the middle 50% of the data.
- Use: A more robust measure of variability than the range, because it is not affected by extreme values or outliers.
- Formula: IQR=Q3-Q1
Variance
- Definition: The average of the squared differences from the mean.
- Use: Reflects how data values are spread around the mean. The units of variance are squared, which can make interpretation less intuitive.
- Formula (Population): σ² = Σ(xi - μ)² / N
σ² is the population variance.
Σ is the summation symbol.
xi is each individual data point in the population.
μ is the population mean.
N is the total number of data points in the population.
Standard Deviation (SD)
- Definition: The square root of the variance.
- Formula: standard deviation (σ) = √Variance
- Use: The most commonly used measure of spread in medical research. It expresses the typical distance of values from the mean, in the same units as the data.
Graphical Representation: Box and Whisker Plot
A Box and Whisker Plot (often referred to as simply a Box Plot) is a graphical summary of a dataset that displays its distribution, central tendency, and variability.
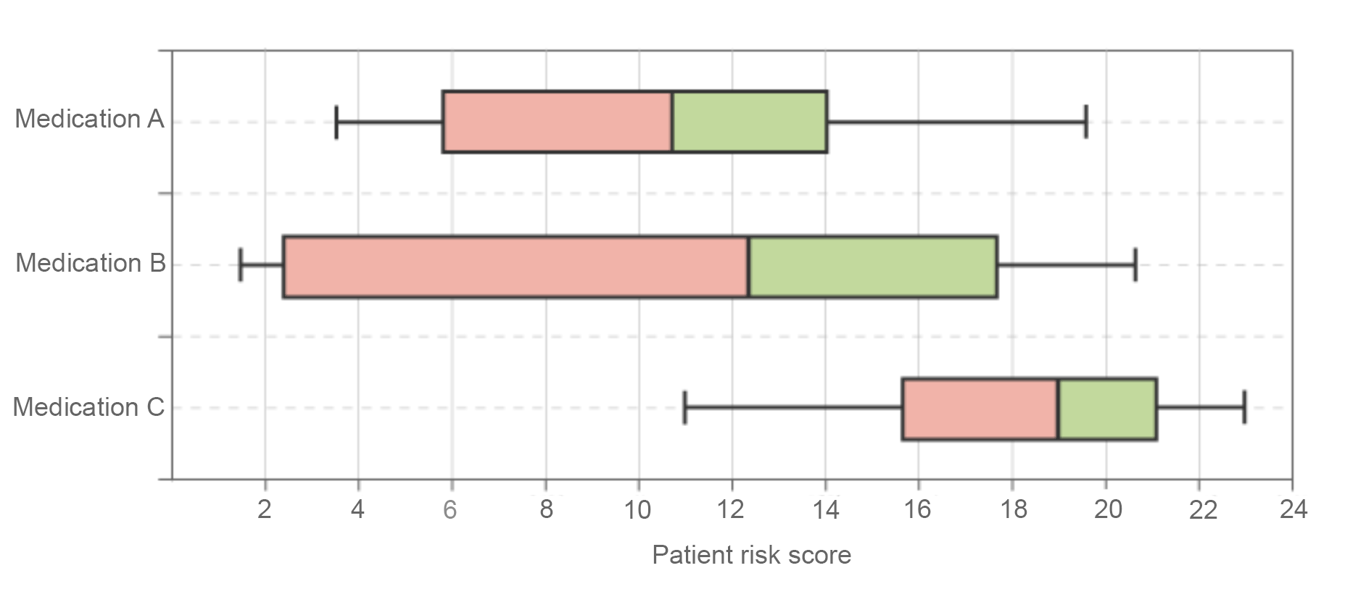 | |
Example of Box and Whisker plot. Note this is a horizontal chart, charts may also be displayed vertically. Click on image to enlarge
What it shows:
- Median (middle value of the data)
- Interquartile range (IQR): The box spans from Q1 to Q3. This range contains the middle 50% of the data values.
- Whiskers: Extend to the smallest and largest values within 1.5 × IQR from the quartiles
- Outliers: Displayed as individual points beyond the whiskers
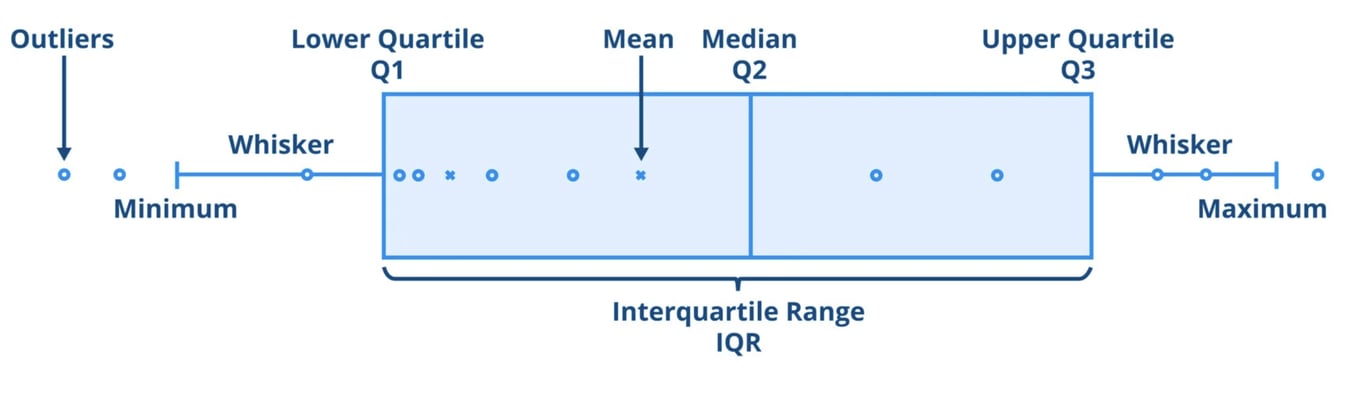 | |
Anatomy of a Box and Whisker plot (Box plot). Click on image to enlarge
Why it's useful:
- Provides a visual summary of distribution, spread, and outliers
- Easily compares multiple groups or conditions side by side
- Ideal for illustrating non-normally distributed data