Cardiovascular physiology: Frank-Starling relationship
The Frank-Starling curve shows the relationship between stroke volume of the heart and how it increases in response to increases in the end diastolic volume when all other factors remain constant.
As can be seen from the graph below changes in inotropy (contractility) move the curve upwards or downwards which effects stroke volume. Increasing inotropy (increasing contractility) moves the curve upward and to the left whilst negative inotropy (decreased contractility) moves the curve downwards to the right.
Stroke volume and cardiac output
Cardiac output is the volume of blood ejected by the heart in a given time frame usually taken to be 1 minute. It can therefore be calculated by the equation below:
Factors increasing stroke volume will therefore increase cardiac output. Stroke volume is influenced by three factors:
Preload
Preload refers to the amount of stretching of the cardiac myocytes at the end of diastole. As myocardial sarcomere length just prior to contraction cannot be directly measured end diastolic volume (filling volume) or end diastolic pressure may be used as surrogate measures of preload. EDV can be measured by echocardiography whilst EDP may be measured using a pressure transducer via a central venous catheter.
Starlings law of the heart states that the force generated and energy released during contraction depends on the initial muscle fibre length . Note when cardiac muscle is stretched the number of myofilament crossbridges that can interact increases as does its sensitivity to Ca2+ which increase force of contraction.
Increased afterload may be caused by a number of factors including valve stenosis and hypertension.
As can be seen from the graph below changes in inotropy (contractility) move the curve upwards or downwards which effects stroke volume. Increasing inotropy (increasing contractility) moves the curve upward and to the left whilst negative inotropy (decreased contractility) moves the curve downwards to the right.
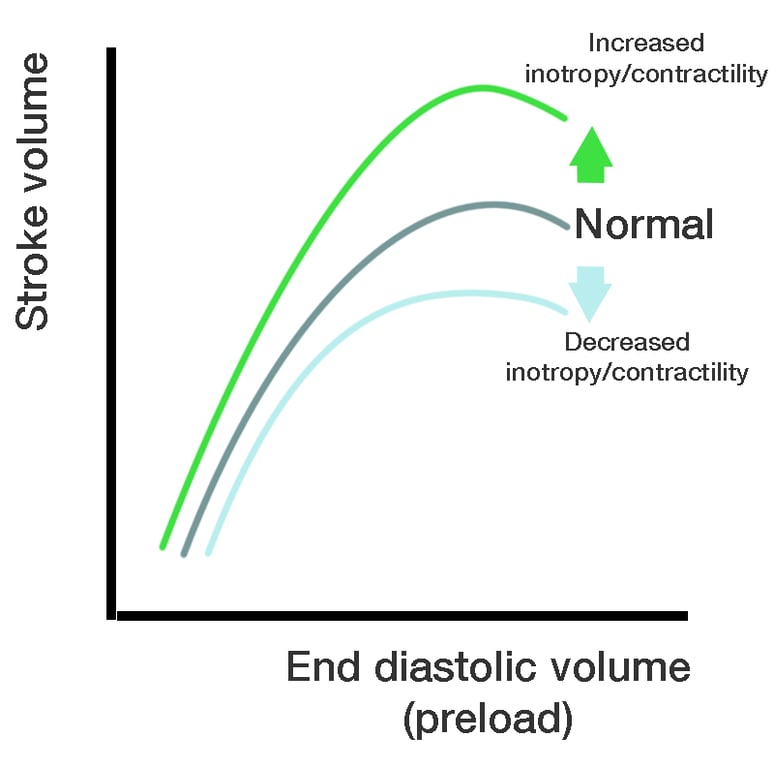 | |
The Frank-Starling curve demonstrates the relationship between end diastolic volume (or pressure) and stroke volume
Stroke volume and cardiac output
Cardiac output is the volume of blood ejected by the heart in a given time frame usually taken to be 1 minute. It can therefore be calculated by the equation below:
Cardiac output (CO) = Stroke volume (SV) x Heart rate (HR)
Factors increasing stroke volume will therefore increase cardiac output. Stroke volume is influenced by three factors:
- Preload (preload is the amount of stretch of the myocardium at the end of diastole i.e. just prior to contraction)
- Contractility of the heart (ability to produce force during contraction)
- Afterload (pressure against which the heart has to pump)
Preload
Preload refers to the amount of stretching of the cardiac myocytes at the end of diastole. As myocardial sarcomere length just prior to contraction cannot be directly measured end diastolic volume (filling volume) or end diastolic pressure may be used as surrogate measures of preload. EDV can be measured by echocardiography whilst EDP may be measured using a pressure transducer via a central venous catheter.
Contractility
Contractility or inotropy is the ability of the heart to produce force during contraction at a given muscle length.Starlings law of the heart states that the force generated and energy released during contraction depends on the initial muscle fibre length . Note when cardiac muscle is stretched the number of myofilament crossbridges that can interact increases as does its sensitivity to Ca2+ which increase force of contraction.
Inotropic agents
Factors that change contractility are termed inotropes. Those that increase contractility are termed positive inotropes whilst those that decrease contractility are termed negative inotropes. Inotropic effects are usually achieved via alteration of free calcium ion concentration. Some specific examples are considered below:Sympathetic stimulation
- Releases noradrenaline which binds β adrenergic receptors increasing Ca2+ entry via L-type calcium channels. Positive inotrope
- Inhibits myocyte from pumping Na+ out of the cell via Na+/K+-ATPase. Increased intracellular Na+ depresses the Na+-Ca2+ exchange pump which pumps calcium out of the myocyte. More Ca2+is left in the myocyte. Positive inotrope
Acidosis
- The raised H+ ion concentration is thought to compete with Ca2+ for intracellular calcium binding sites thus desensitising cardiac myoctyes to calcium. Negative inotrope
Afterload
Afterload is the resistive force the heart has to pump against. Increasing the pressure against which the ventricles must pump blood will result in a reduction of blood volume pumped i.e. increasing afterload will decrease ejection fraction and stroke volume which in turn decreases cardiac output unless the heart can compensate by increasing its force of contraction.Increased afterload may be caused by a number of factors including valve stenosis and hypertension.
The effect of afterload on the Frank-Starling curve is the opposite to that of inotropy (contractility) i.e:
- Increasing afterload shifts the Frank-Starling curve down to the right.
- Decreasing afterload shifts the Frank-Starling curve up and to the left.